Have you ever found yourself struggling to justify your results? Having to explain that the engagement you generated is actually really great?
Let us help you prove your campaigns are successful. Or, why you might need to pause and review the campaign to improve results.
Jump right in:
Why you need benchmarks in digital marketing
Benchmarks give you a target to aim at. A guide to know if your campaigns are succeeding or failing.
With clearly defined benchmarks you can adapt your digital marketing campaign to focus resources and budget on those channels which are succeeding and reduce spending or modify where campaigns aren’t working.
Use benchmarks wisely
Make sure the benchmarks you’re using apply to your market and geographic area.
Generally speaking, when targeting HCPs, your target market will be small and specialised. So your benchmarks need to be appropriate for your audience size in your target region on that particular platform.
Understanding the metrics
Digital marketing can provide a LOT of metrics and numbers. But, not all of these numbers are equally valuable.
It’s important that you define what success looks like for each campaign – success for a branding campaign will look quite different to one targeted at engagement or education.
Within each channel there will be a number of metrics to define success, make sure you are focusing on the one that aligns with your campaign goal.
Defining Success – the facts and figures
Now, let’s look at some of the most popular marketing channels in the pharmaceutical industry and help you establish some key benchmarks for each one.
Journal Banners
The old reliable of pharmaceutical marketing!
But just how successful are journal banners? This comes back to those campaign goals you set at the beginning.
If your aim is to increase brand awareness, then banner ads, particularly in industry specific locations (like medical journals) can be helpful.
However for engagement (clicks) the numbers are low.
Non-industry specific (global)
Click Through Rate 0.25-2%
However many medical journals suggest a 0.08% CTR is average.
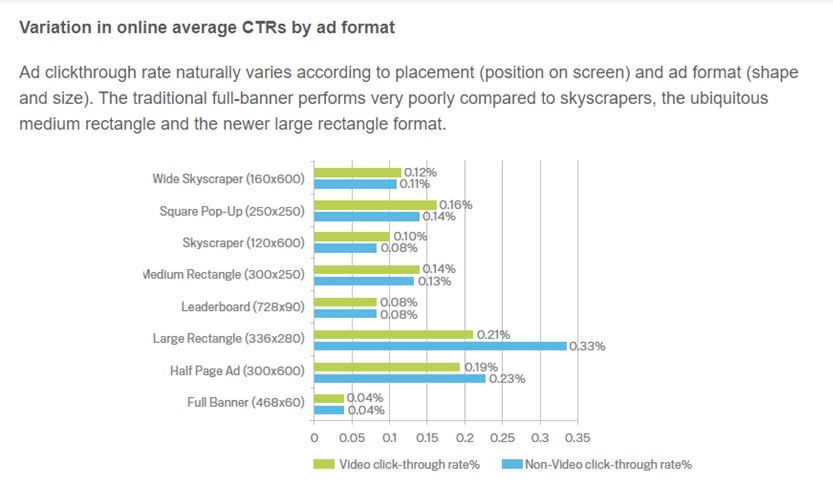
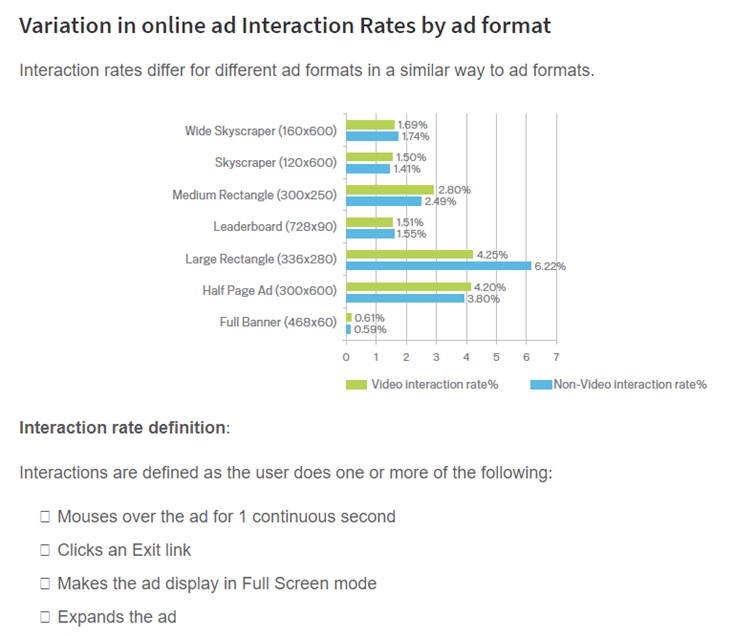
Banner format will also affect click rate as these statistics show.
Another channel that is welcomed by the HCP and salesforce alike!
These statistics are related to your own direct email. eBlasts from larger providers (eg EMJ or congress marketing) may have different metrics based on their own branding.
Pharmaceutical industry (global)
Open Rate – 18.58%
Click Through Rate – 2.25%
Paid Search (eg.Google Ads)
With a highly defined target market searching for industry specific keywords Paid Search can be a cost effective way to drive traffic.
Healthcare (global)
Click Through Rate – 1.79%
CPC – $3.17
In our opinion the CTR mentioned above seems low. We would expect a correctly set up PPC (where you have top position) to have a CTR around 10%.
Perhaps this just shows how many poorly set up Google PPC campaigns there are?
When talking about Twitter we have two different sets of data to review – Organic vs paid / sponsored posts.
With paid / sponsored posts you define an audience for your posts while organic posts rely on the interest of your existing audience. It is also usual for a paid/sponsored post to reach more users than an organic post. It is, after all, in Twitter’s interest to show paid posts.
Organic Posts
Health and Beauty (global inc B2C)
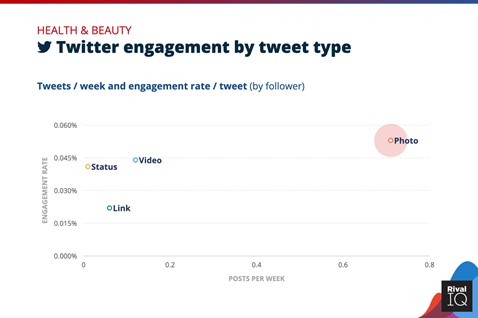
Engagement per post – 0.033%
Non-industry specific engagement rate is a little higher at 0.05%
Engagement on Twitter is when a user takes an action on a specific Tweet, (Retweets, Favorites, Replies, URL Clicks, Hashtag Clicks, Mention Clicks, and Media Views). These are the same actions for both organic and paid posts.
Based on avg of 1.8 tweets per week
However, as with all things, the post format makes a significant difference. Posts with photos have the highest engagement rate on Twitter
Paid Posts
Non-industry Specific
CTR – 0.86%
CPC – $0.58
CPM – $5.00
A popular choice for targeting specific professions and specialities. Once again we see a wide variety of engagement rates depending on ad format. As with many social media networks, videos are becoming increasingly popular.
Engagement
Non-industry specific (global)
Non-video Sponsored Content – 0.5%
Video Sponsored Content – 1.6%
Video View-through rate – 29.5%
On Linkedin engagement actions include reactions, comments, shares, and follow clicks
LinkedIn also provides additional information for video views, showing number of views at 25%, 50%, 75% and complete.
CTR
Non-industry specific (global)
CTR – 0.22%
These clicks are when a user follows a link to another page within LinkedIn or an external website. But its value depends on your goals – you might find a video has high engagement but low CTR. If the video is encouraging views or other engagement those can be just as valuable.
Healthcare industry (global)
CTR – 0.58%
Different ad formats also have a different CTR:
- Sponsored Content (Single Image): 0.56%
- Sponsored Content (Carousel): 0.40%
- Sponsored Content (Video): 0.44%
- Message Ads: 3% with open rates at 30%
- Text Ads: 0.02%
Webinars
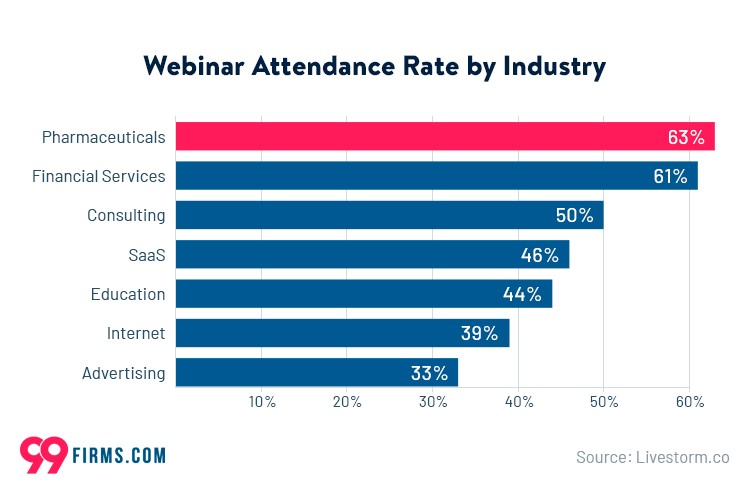
A tool where the pharmaceutical industry is a leading player with the highest webinar attendance rate (people who watch the webinar after signing up)!
Pharmaceutical
Attendance rate 63%
Live vs On Demand
For time poor HCPs it’s also important to look at the difference between Live webinars (with the benefit of interaction) vs on-demand webinars which can be watched at a more convenient time.
None of these figures are industry specific and they are taken from 2020 and 2021 when webinars had a much higher demand. We wait and see what happens in 2022 as restrictions lift and in person events become possible again.
Of your registered attendees
34% will watch live
with an additional 15% watching on demand later.
How much do they watch?
During live webinars you will still have 80% of your viewers at 15 minutes and 58% will watch to completion.
In 2020 the average viewing time was 57 minutes.
On Demand viewing time is shorter at 29 minutes but this may indicate viewers skipping sections (ie intro)
Do you need an on demand replay?
Yes as 43% of attendees only watch on demand webinars
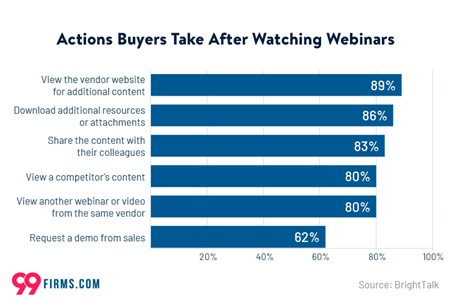
After the webinar
Don’t forget to monitor the actions your webinar attendees take after watching the webinar!
Videos
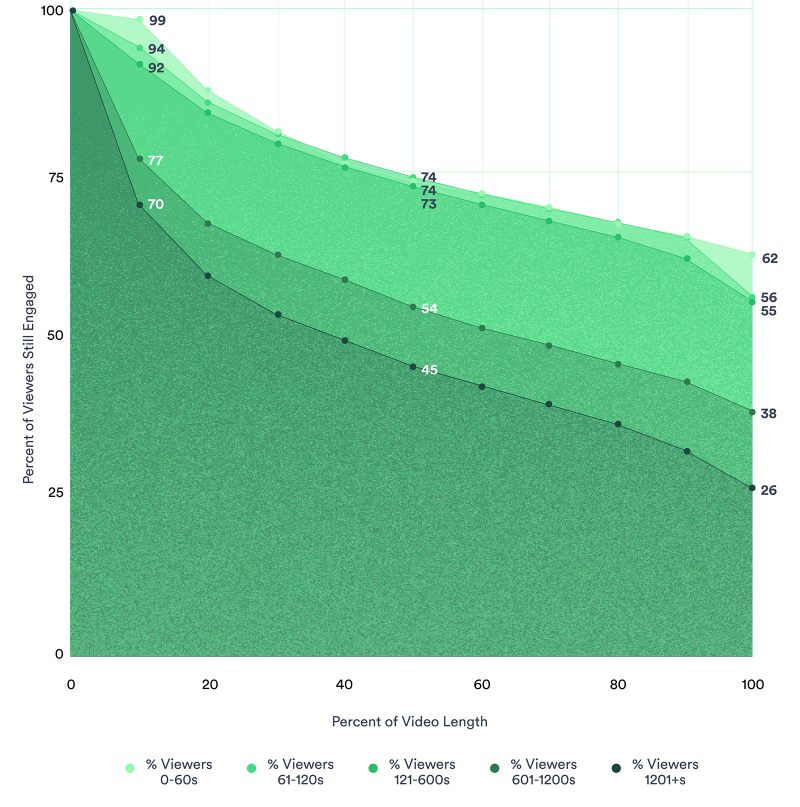
More a support than a channel, videos are increasingly used to reach prospects (video creation increased by 178% in 2021). But in a world where viewers are increasingly busy, marketers must understand that viewer engagement (in this case, retention) isn’t going to be the same if the video is 1 minute long or 20 minutes long. The same logic applies for the runtime of the video since retention decays as the video goes on.
Therefore, the main benchmarks to look at for your video content is the engagement for different lengths of video. These benchmarks are important not only to understand how your video content performs, but also to create better videos and ensure the key elements you want to communicate reach the highest number of viewers.
In 2021, 54% of viewers watched a video until the end (regardless of length)
Viewer engagement peaks at the first 10% of runtime
62% of viewers watch the full video when under 1 minute long
Only 26% of viewers watch a video until the end when more than 20 minutes long
Videos under 20 minutes have up to 38% higher retention
Go and prove your success!
Now you have the facts and figures you can review your quarterly reports and quickly see what’s working and what isn’t. So you can review and respond to double down on your success.